
Interproximal Caries: Visual Exam, Fluorescence and Bitewing, Side by Side
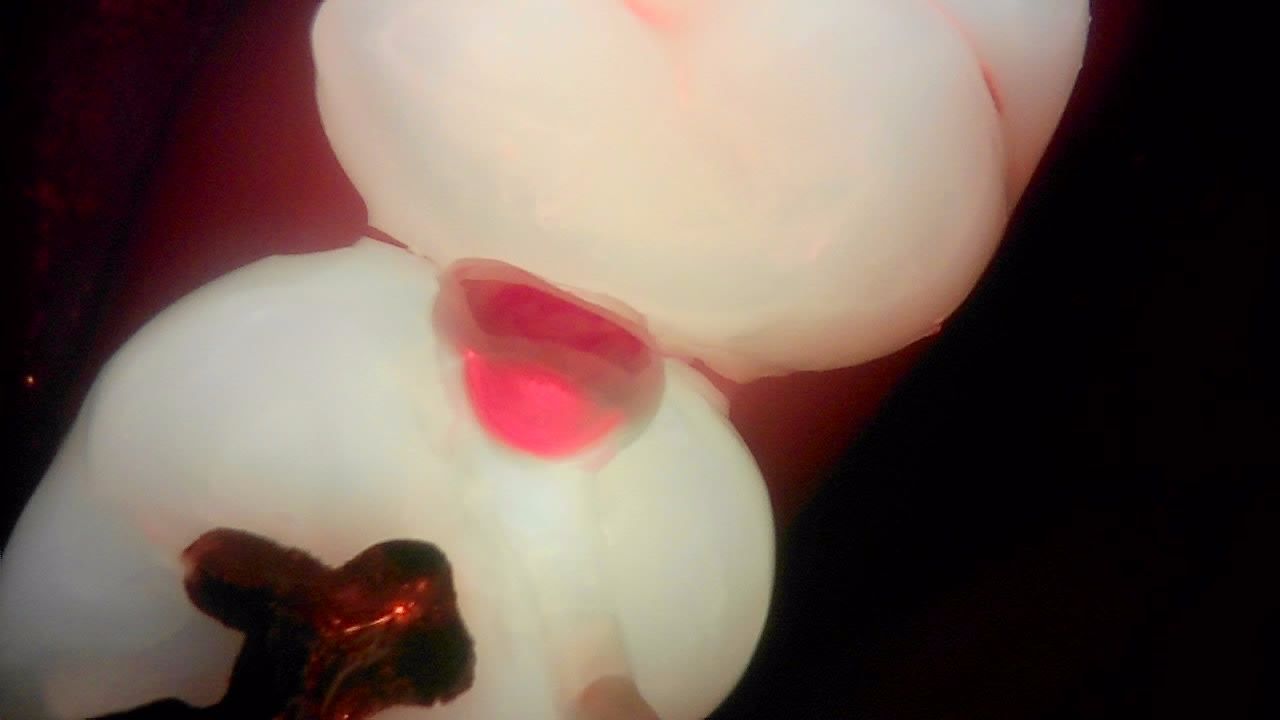
Why does interproximal caries so often end with "it was deeper than I thought"? You open the marginal ridge and find the lesion has traveled much further than the surface suggested. Most of us have been there. The lesion sits behind the adjacent tooth, and the marginal ridge above it still looks intact. This post lines up three views of the same proximal surface — the visual exam under white light, Qray fluorescence and the bitewing radiograph — and walks through what each one actually shows chairside.
Why is interproximal caries so hard to see?
Most proximal lesions begin below the contact point, so there is little to see on the surface until they have progressed. A Yonsei University team (Kim et al., Photodiagnosis Photodyn Ther 2017) makes this point in their introduction and cites a systematic review: for proximal caries, the visual exam had high specificity (0.908–0.992) but low sensitivity (0.274–0.543).
That is why the bitewing has long been the reference for proximal surfaces. The same paper notes that bitewing radiography outperformed visual inspection for dentin-level proximal caries and is widely used to make restorative decisions. It also cites ADA guidance that radiographs should be prescribed on an individual basis rather than as a screening routine.
In kids, it is even harder. Small proximal lesions in primary teeth can hide under the contact point, and radiographs may have low sensitivity for early enamel lesions — while we also want fewer films in children.
What does each of the three views show?
Each view shows a different side of the same lesion. In one clinical case, an interproximal lesion was summarized like this:
| View | What interproximal caries looks like | What it tells you |
|---|---|---|
| Visual exam (white light) | Increased opacity of the tooth | Change that has reached the surface |
| Qray fluorescence | Red fluorescence showing through from beneath the surface | Functional information — loss of fluorescence and the red signal of bacterial metabolism |
| Bitewing radiograph | A "double triangle" radiolucency at or just below the contact point | Structural information — extent and depth |
The red signal does not sit on the surface; it shows through from underneath. Kim and colleagues describe red fluorescence from proximal caries as having irregular boundaries and coming from the underlying structure, whereas surface confounders like plaque, cracked enamel or some resins tend to have more regular boundaries. Their advice: clean the surfaces before capture and read carefully.
You read the three together because each one misses something different. The visual exam sees the surface, fluorescence sees what is changing just beneath it, and the radiograph sees how far the lesion extends into enamel and dentin. None of them stands in for the others.
Clinical case: a red signal under an intact marginal ridge
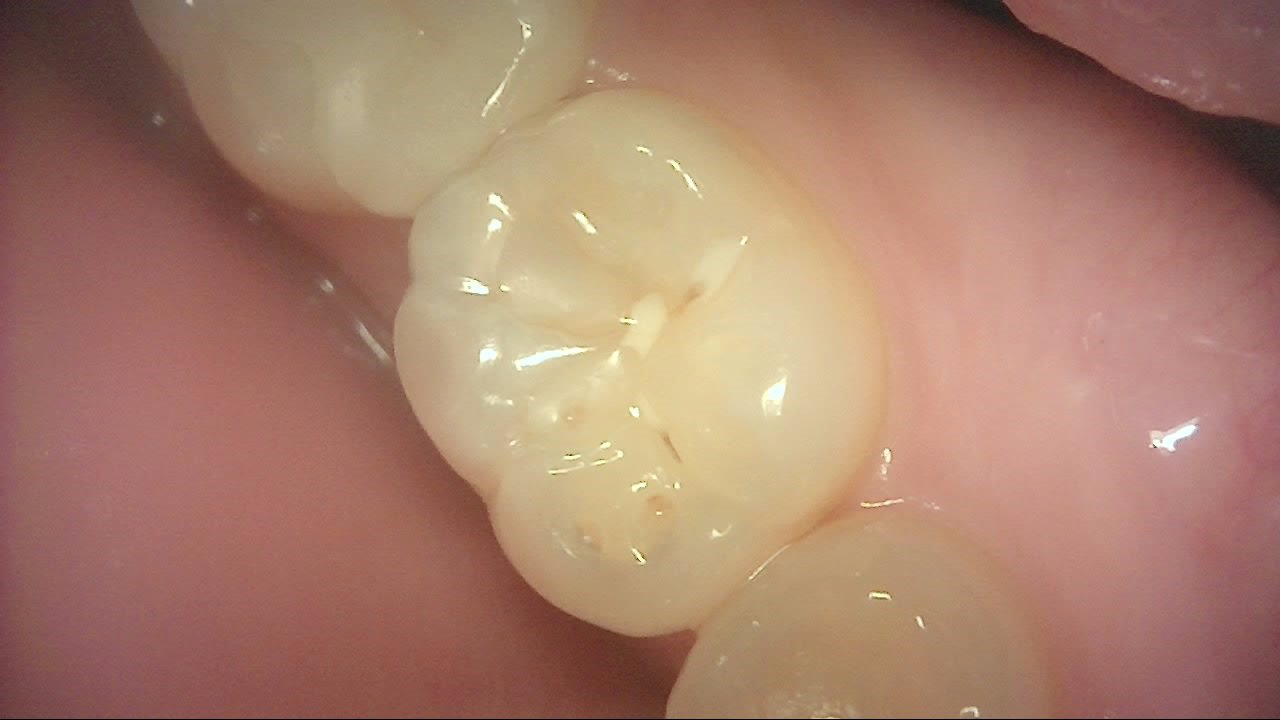
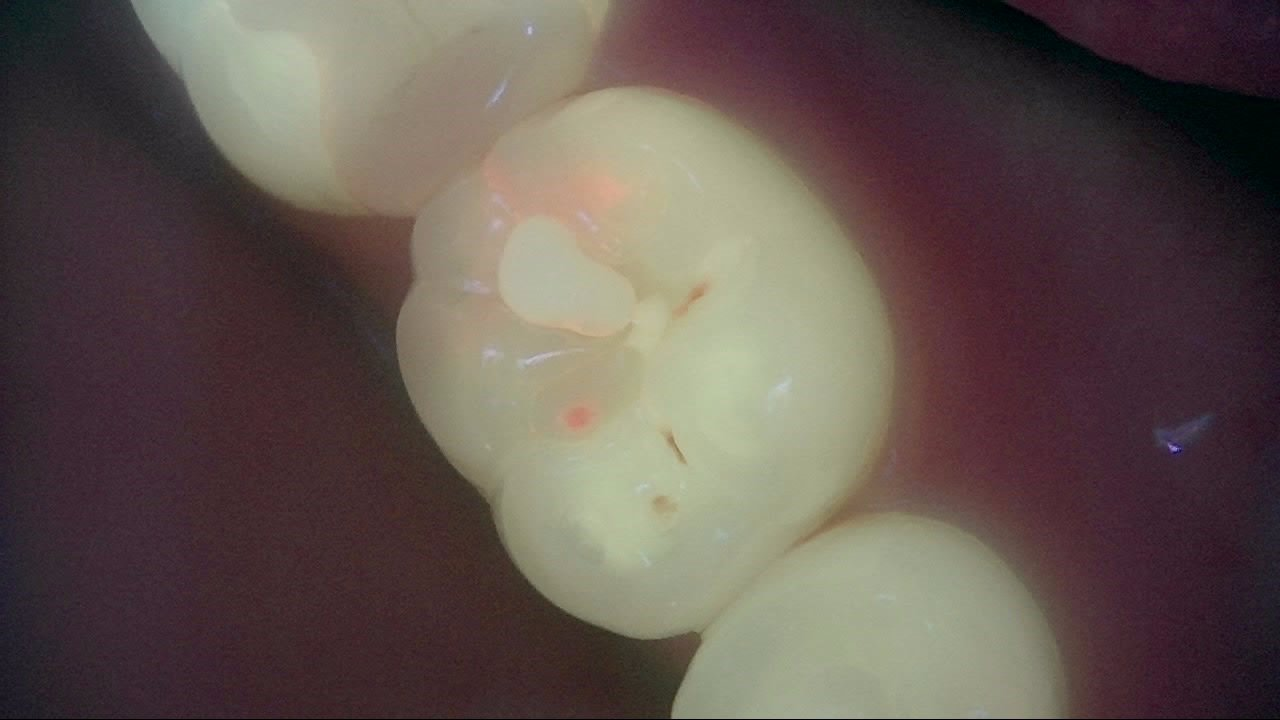
Under white light the marginal ridge looked smooth; under fluorescence a faint red signal appeared in the same area. Both images below were captured on the same tooth at the same visit.
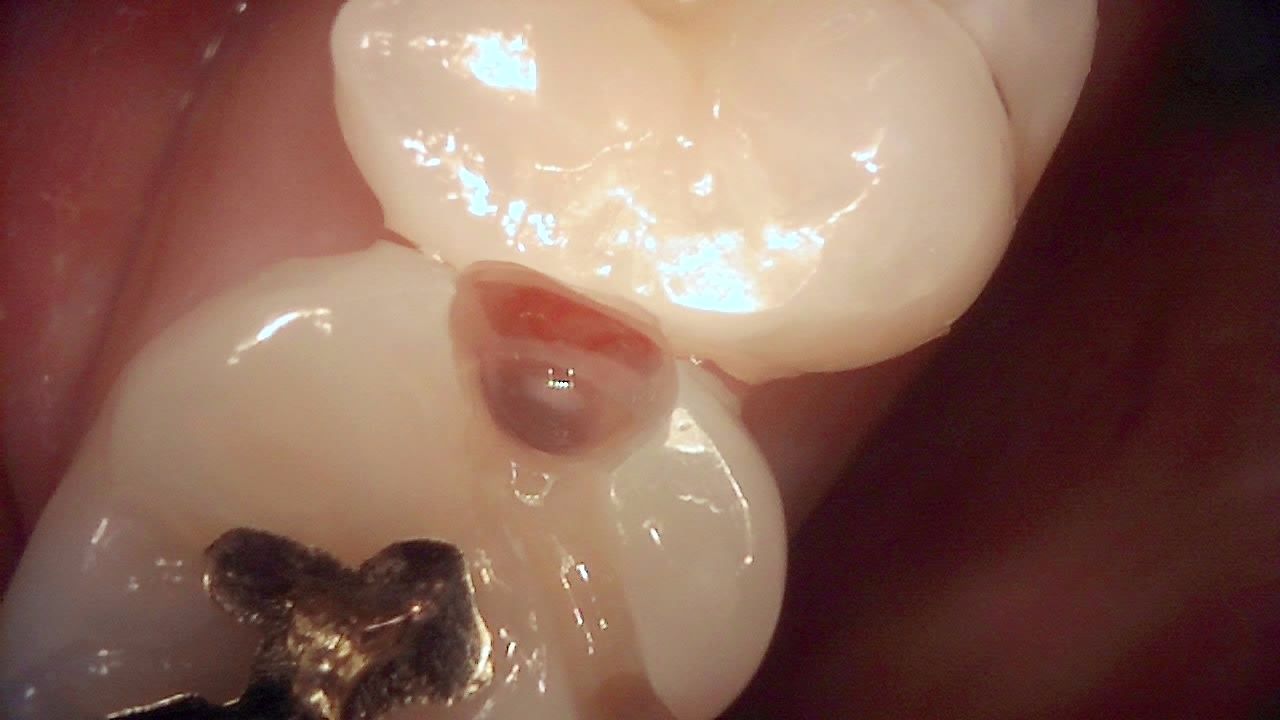
Once the proximal lesion is exposed, the red is far more obvious. In one clinical case, red fluorescence was visible on the proximal surface in the Qraypen C image, and a stronger red appeared after the enamel layer was removed.
How much can you rely on fluorescence for proximal caries?
In a clinical study, a simple 0–3 fluorescence score (QS-Proximal) tracked closely with bitewing findings. Kim and colleagues assessed 280 proximal surfaces in 65 adults with the visual-tactile exam, bitewings and QLF. The bitewing was the reference standard. Fluorescence images were taken from the occlusal direction, reading the change reflected on the marginal ridge.
| QS-Proximal score | What the fluorescence image shows |
|---|---|
| Q0 | No dark shadow, no red fluorescence |
| Q1 | Irregular dark shadow, no red fluorescence |
| Q2 | Faint red fluorescence within 1/3 of the buccolingual width |
| Q3 | Strong red fluorescence over 1/3 of the buccolingual width |
For dentin-level proximal caries, QS-Proximal reached an AUROC of 0.826–0.864. In the same study, the quantitative fluorescence-loss and red-fluorescence values reached 0.860 and 0.902 at the dentin level, but only 0.655 and 0.686 at the enamel level. The QS-Proximal score correlated with the radiographic score at 0.537, versus 0.280 for the visual score.
The limits matter just as much. The authors note that occlusal-direction images are better suited to advanced lesions than early ones, and that adjacent pit caries, plaque, cracked enamel and some resins can confound the red signal. Read fluorescence as information that supports your bitewing and visual exam — not as a stand-alone call.
What does a chairside workflow look like?
When fluorescence shows something unexpected, show the patient, then confirm with a bitewing. If an abnormal area appears on the fluorescence image that was not visible on the regular image, a reasonable approach is to explain it to the patient and examine it in more detail with a bitewing or Qraypen C — after removing surface debris and surrounding biofilm.
- Screen the arch with Qraycam Pro and note any red areas.
- Remove the old biofilm around the tooth.
- Recapture that tooth up close with Qraypen C.
- Take a bitewing as indicated to confirm extent.
The fluorescence image can also be the reason a patient says yes to the radiograph. In one clinical case, the patient was shown the difference on a Qraycam Pro image and an X-ray was recommended. The patient accepted after looking at the area; without the image, the patient would likely have declined. The bitewing was then read alongside the image, and the red area was removed step by step with recaptures along the way.
One image during treatment builds trust. A common recommendation is to capture the dentin lesion after the enamel is removed and show it to the patient during or after treatment.
What's next
The proximal fluorescence image you capture today is recorded in LINKDENS and shared with the patient as a report. If you decide to monitor rather than restore, you can recapture the same surface under the same conditions at the next visit and compare it side by side with the last record. For a practice owner, that turns "we'll keep an eye on it" from a vague promise into something you and the patient check together. When that flow continues through QBLISScare, one signal between the teeth becomes ongoing care.
FAQ
Q. Can fluorescence alone diagnose interproximal caries?
A. No. Qray fluorescence shows functional change beneath the surface. The extent and depth of a proximal lesion are judged by the dentist together with the bitewing radiograph and visual exam. In the study above, the bitewing was the reference standard.
Q. From which direction do you capture proximal surfaces?
A. Kim et al. (2017) captured from the occlusal direction and read the change reflected on the marginal ridge. The authors note this direction suits advanced lesions better than early ones, and recommend cleaning the surfaces first.
Q. Red fluorescence on a proximal surface — restore right away?
A. Treat red as a signal to start managing together. Remove the biofilm, recapture, take a bitewing as indicated, and then decide whether to monitor, prevent or restore. That decision stays with the dentist.
References
- Kim ES, Lee ES, Kang SM, et al. A new screening method to detect proximal dental caries using fluorescence imaging. Photodiagnosis Photodyn Ther. 2017;20:257–262. DOI